

Atrial Rhythms
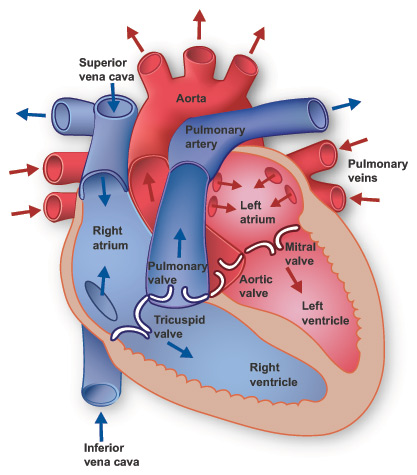
Cardiac conduction system
These are rhythms that originate somewhere in the atria other than the SA node. Causes include loss of SA node capability and atrial irritability. P waves in this category will have a different appearance than those beats generated from the SA node (can be notched, flattened, peaked, or sawtooth).
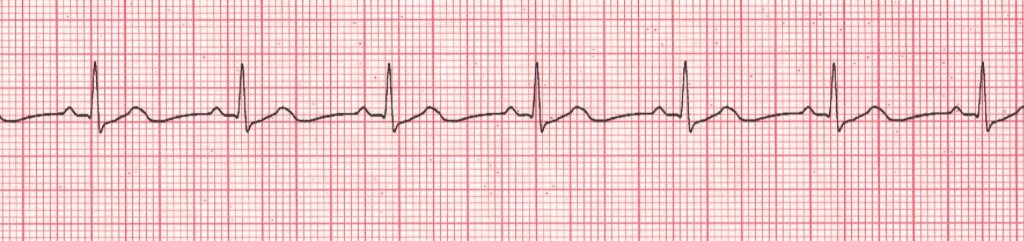
Wandering atrial pacemaker
Example Wandering atrial pacemaker

· Rules: R-R slightly irregular ,
Rate 60-100bpm ,
P wave appearance changes with each beat ,
PRI varies but is usually
· Causes: Can be normal- seen in very young, very old, or athletic patients
· Clinical Picture: Usually asymptomatic
· Management: None needed
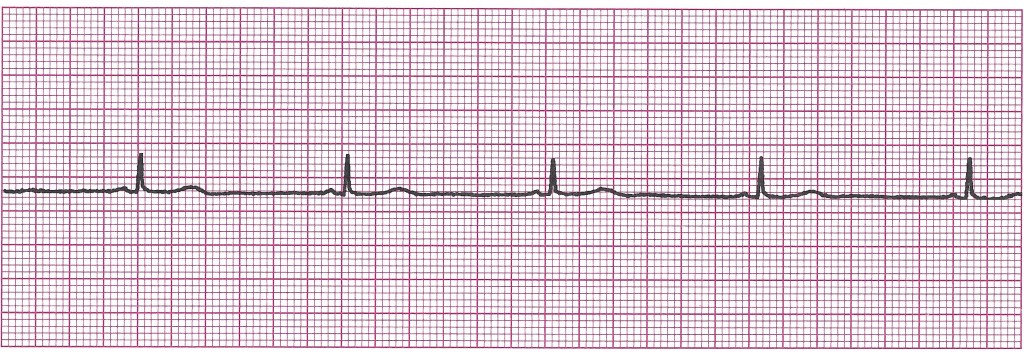
Premature Atrial Contractions (PAC’s)
It is a type of atrial ectopy caused by irritability. It is a single beat. It is important that you always identify the underlying rhythm and locate the ectopies throughout that rhythm.
Example of PAC
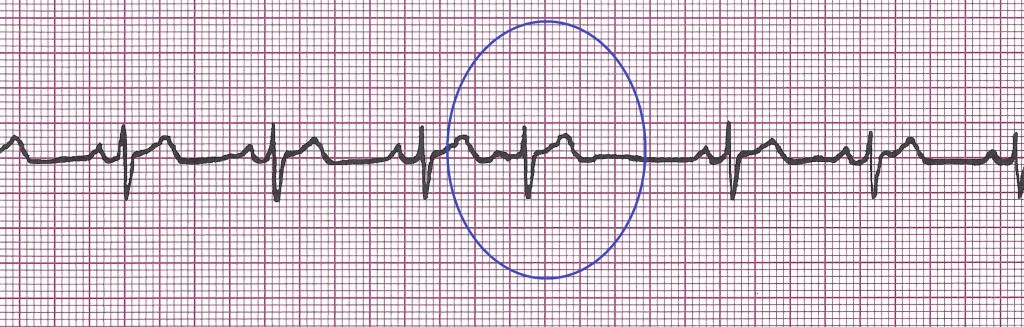
· Rules: Rhythm will appear irregular due to the ectopic beats interrupting.
Rate depends on underlying rhythm
P wave of the PAC will look different from the rest of the strip. It usually has a QRS following but can be blocked.
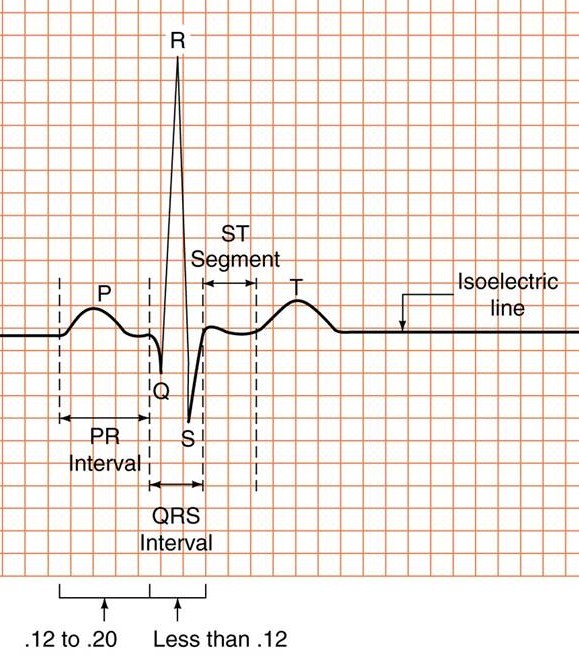
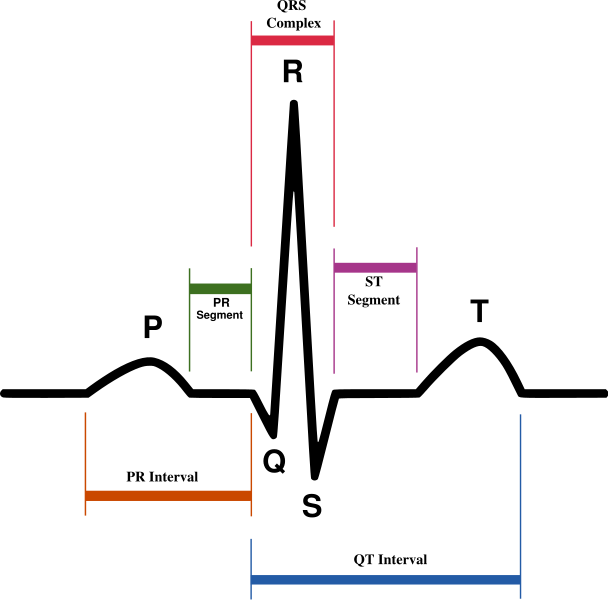
PRI 0.12-0.20sec (PAC’s PRI may be longer or different from the others)
QRS <0.12sec
· Causes: fatigue, hypoxia, Digoxin toxicity, caffeine, ischemia, CHF, or ETOH
· Clinical Picture: irregular pulse, but usually asymptomatic
· Management: Treat the cause. Monitor as it can lead to atrial tachyarrythmias. Oxygen, monitor, IV.
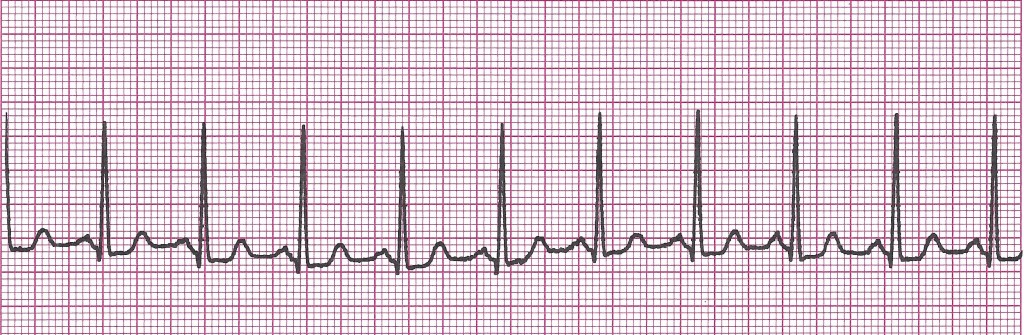
Atrial Tachycardia (AT)
Because of its fast rate and supraventricular origin, atrial tachycardia usually gets interpreted as SVT (See SVT in next section)
· Rules:
Regular
150-250bpm
P wave is atrial in origin (not sinus) and may be lost or hidden in T wave due to the fast rate
PRI 0.12-0.20sec
QRS <0.12sec
· Causes: Excessive amount of catecholamines like epinephrine, norepinephrine, and dopamine, or Digoxin toxicity
· Clinical Picture: Rapid, regular pulse. May show symptoms of decreased cardiac output like, dizziness, fatigue, short of breath, syncope. May have chest pain or palpitations
· Management: O2, monitor, IV. Vasovagal maneuvers, carotid massage, drug therapy like Ca channel blockers, Beta-blockers, antiarrhythmics, or cardioversion.
Atrial Flutter (A-Flutter)
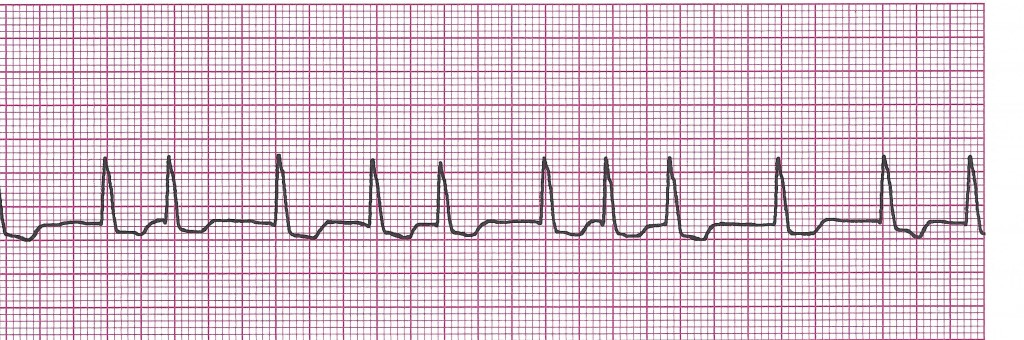
Example of Atrial flutter
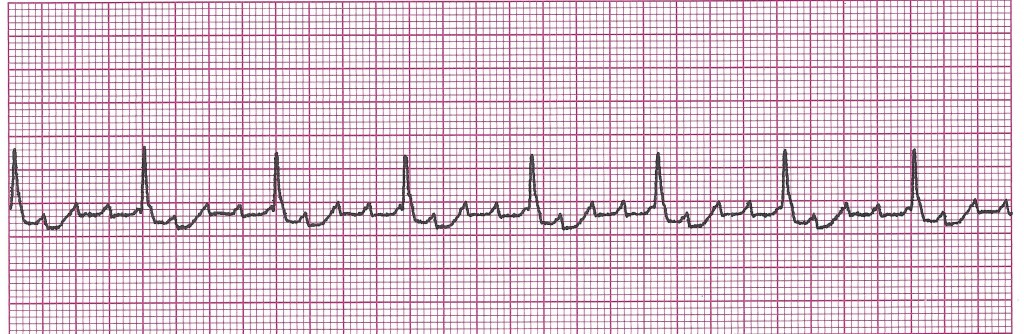
· Rules: Usually regular but can be irregular
Atrial rate is usually 250-350bpm, ventricular rate can vary
P waves are upright and sawtooth
PRI –not applicable
QRS <0.12sec
· Causes: CAD,Rheumatic heart disease, hyperthyroid, MI
· Clinical Picture: If there is a rapid ventricular response- patient may have symptoms of decreased cardiac output like, dizziness, fatigue, short of breath, syncope and palpitations. Can lead to CHF.
· Management: Oxygen, monitor, IV. Treat the cause. Anticoagulant therapy is initiated due to increased risk of clots (the rapid atrial contraction causes turbulence in the blood which the body thinks is an injury- this causes platelets to collect at the site of the turbulence causing clots). If there is RVR, drug therapy such as Ca channel blockers, beta-blockers, and antiarrhythmics like Digoxin, Corvert, or Amiodarone can be used. Atrial pacing and cardioversion are options if patient becomes unstable.
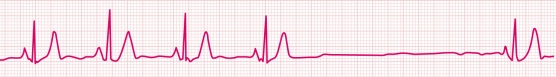
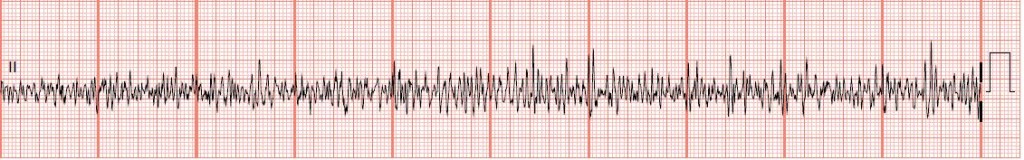
Atrial Fibrillation (A-Fib)
Example of A-Fib
· Rules: Totally irregular.
If ventricular rate 100 “Rapid ventricular response”
No true P waves are produced in this rhythm, just fibrillatory waves
PRI unmeasurable
QRS <0.12sec
· Causes: MI, Digoxin toxicity
· Clinical Picture: Irregular pulse, may have symptoms of decreased cardiac output like, dizziness, fatigue, short of breath, syncope and palpitations. Can lead to CHF.
· Management: Oxygen, monitor, IV. Treat the cause. Anticoagulant therapy is initiated due to increased risk of clots (the rapid atrial contraction causes turbulence in the blood which the body thinks is an injury- this causes platelets to collect at the site of the turbulence causing clots). If there is RVR, drug therapy such as Ca channel blockers, beta-blockers, and antiarrhythmics like Digoxin, Corvert, or Amiodarone can be used. Atrial pacing and cardioversion are options if patient becomes unstable.
STOP! TIME FOR PRACTICE STRIPS ON VARIOUS ATRIAL RHYTHMS


